The Variable Explorer allows you to browse and manage the objects generated by running your code interactively.
Variables Pane is available in the debugger console in PyCharm – we need to run our code in debug mode to see the variables explorer.
The pane shows the names and values of all the objects on the script being executed. The explorer also allows you to add, remove, edit and watch the values of different objects.
PyCharm Layouts
The Figure below shows all the components of PyCharm that we need to know before exploring variables in Pycharm. First, we need to compile our code in debug mode – for that, we need to use the “debugging button“.
Debugging executes the code until it finds a “breakpoint“, and then the execution is stopped. You can then resume the execution until the next breakpoint using the resume button on the bottom left (see the Figure below).
Once debugging is started, the debugger console will appear, and the variables pane will be right there.
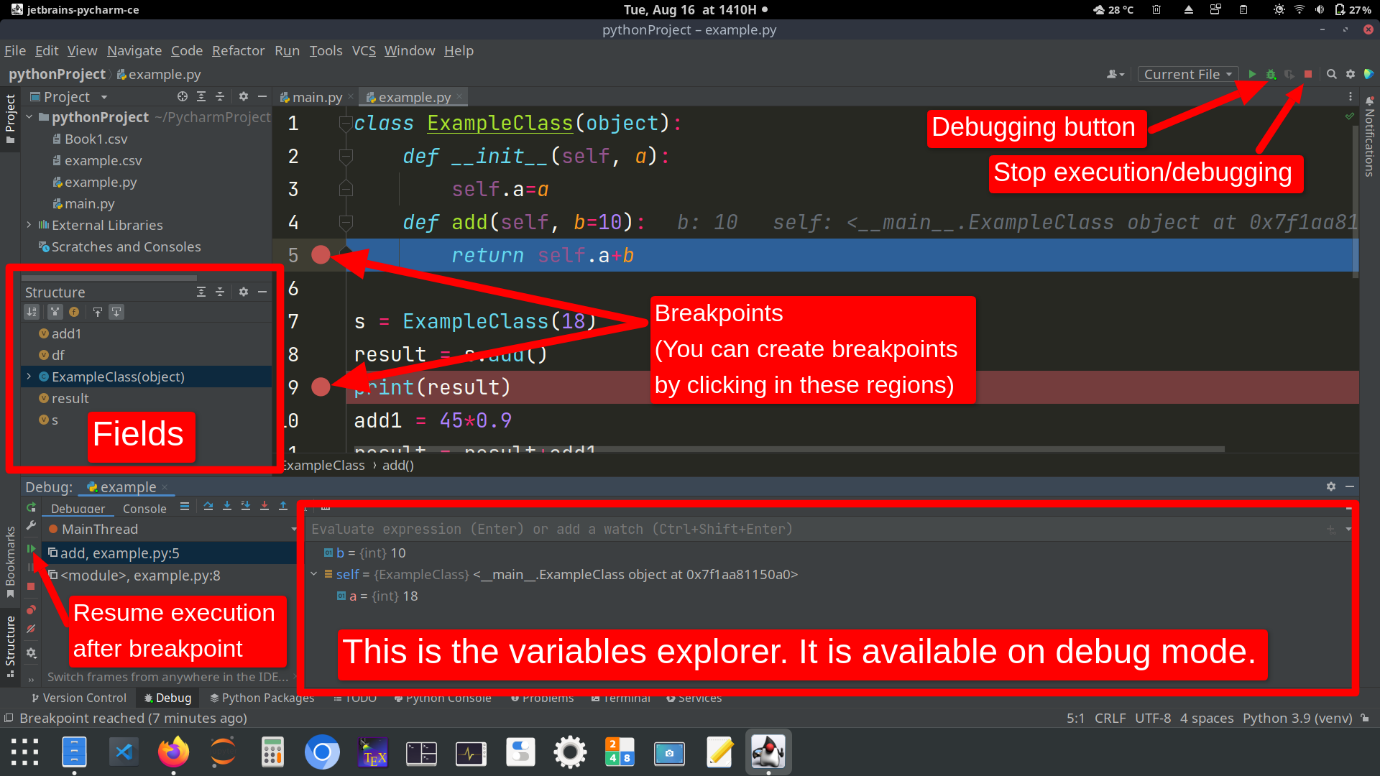
Figure 1: PyCharm layout showing all the components we need to view to variable explorer. Your layout might be slightly different based on your configurations, but the general view should not be confusing.
Example – Viewing Variables Explorer
In this section, we will work on an example of how to use the variables pane in Pycharm. We will save the following code into an “example.py” file and execute the script on PyCharm. Create five breakpoints on the numbered lines marked with “#<<<” as shown in Figure 1.
|
1 2 3 4 5 6 7 8 9 10 11 12 13 14 15 16 17 18 19 20 21 22 23 |
import pandas as pd import numpy as np class ExampleClass(object): def __init__(self, a): self.a=a def add(self, b=10): return self.a+b #<<< (1) s = ExampleClass(18) result = s.add() print(result) #<<< (2) add1 = 45*0.9 result = result+add1 print(result) #<<< (3) df = pd.DataFrame({"Names":[1, 2, 3], "Streets":["Benard 23", "Wedding 66", "Koisagat 56"]}) print(df) #<<< (4) arr1 = np.array([[1, 2],[3, 4], [5, 6]]) print(arr1) #<<< (5) |
Once the script is opened in PyCharm, hit the debug button and the variables explorer will be displayed as shown below
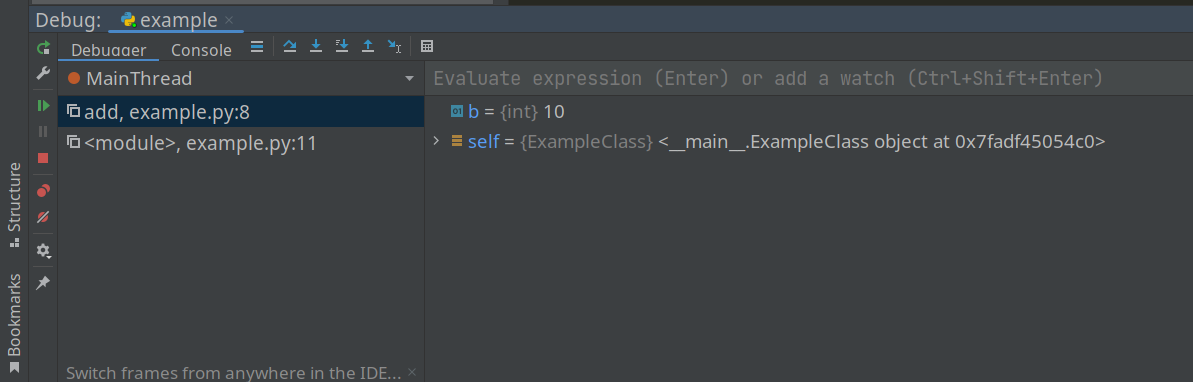
The first execution stopped in breakpoint 1 capturing ExampleClass instance and an integer b assigned value 10. We will proceed to the next step by hitting the resume execution button. That will execute the code from breakpoint 1 to the second breakpoint.
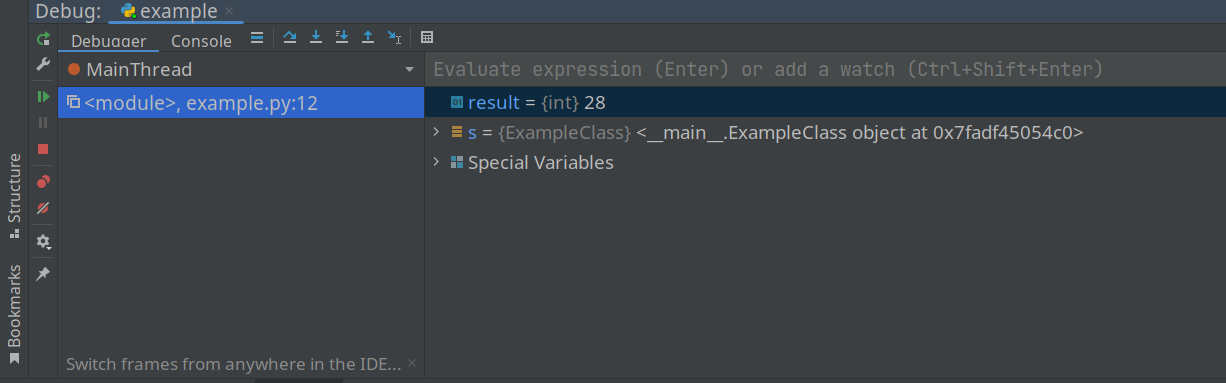
This execution now picks the “result” variable which stores the number 28. The Special Variables contain special objects like magic functions, and loaded modules (in our case NumPy and Pandas).
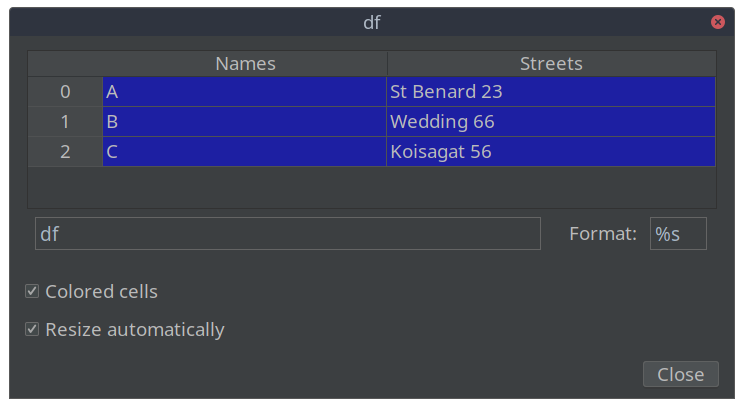
At breakpoint 4 the data frame “df” will be displayed on the variables pane and we can be able to view it in a nice table (see below).
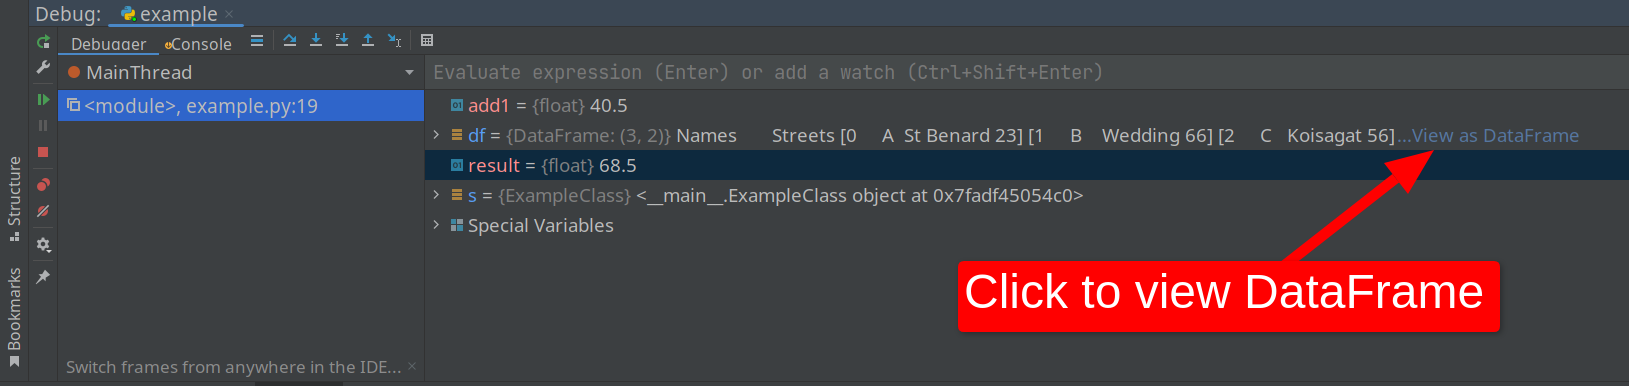
When you click “View as DataFrame” (you might need to right-click to see this option) the DataFrame will be displayed as shown below (you can use the same process to view the “arr1” Numpy array in our code).
Note: Variables change color when the value has changed since the last evaluation. For example, in our case, the result variable changed color.
Important: If you want to inspect a given variable using the variable explorer in PyCharm, place a breakpoint below that variable and run the code in debug mode, and the variables will be displayed in the console.
Conclusion
In PyCharm, the variable explorer is available on debug console. If you want to inspect a given variable, place a breakpoint below the variable and execute the code in debug mode.